By popular demand, I have added a landing page on Comichron encapsulating the larger publisher market shares as far back as they are known, which is to 1991. You can click to see the annual market shares across time, which will be the permanent home of this material — but I’ll be recapping it all below.
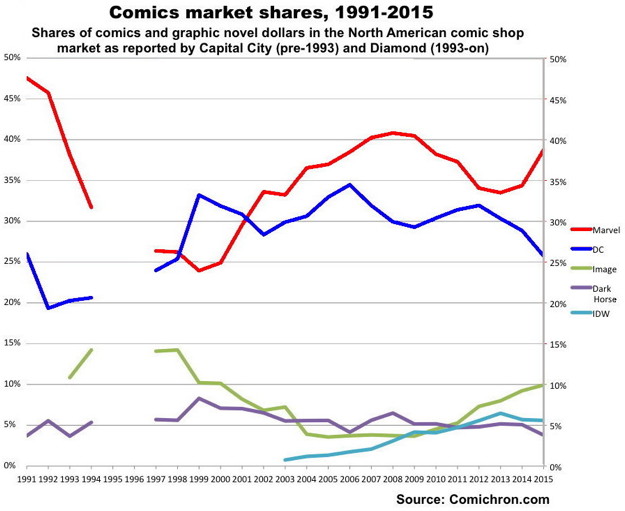
Diamond Comic Distributors, the sales agent for most North American comics publishers serving the comics shop “direct market,” reports annual market shares at the end of the year for its sales of comic books, trade paperbacks, and magazines. Above are the reported full-year market shares for several consistently large publishers over the last several years.
Before 1993, the figures are from Capital City Distribution, because Diamond did not report annual shares back then; 1991 was Capital City’s first year for reporting them. Previously, Marvel‘s share in the 1980s was thought to have topped 70%, if you included the newsstand; that lead eroded in the late 1980s with the Black-and-White Independent Comics Boom, and the rise of several new publishers including, in the early 1990s, Malibu and Valiant.
Marvel share dropped precipitously in the early 1990s due to the departure of many of its top creators to start Image. There were no annual shares figures available during the Exclusivity Wars of 1995-96, when it was no longer possible to obtain all comics from a single distributor. (Read more about that period here and here.) That coincided with Marvel’s sales collapse and later bankruptcy. DC passed Marvel in the late 1990s due to its early and aggressive adoption of graphic novels and trade paperbacks.
Marvel reclaimed the lead in the early 2000s. Image’s share decreased in the late 1990s due to Wildstorm Studios‘ move to DC, with the publisher’s percentages improving later following the debut of the Walking Dead TV show. IDW, launching in the early 2000s, grew steadily in that decade and became the #4 publisher in the 2010s. Dark Horse, as you see, remained fairly steadily around that 5% line for the past quarter-century. DC ticked up again in 2011 during its relaunch; Marvel has increased its lead in recent years.
The above figures account for the majority of the comic books moving through the comics shop system, though in more recent years the book channel has grown much larger. The above chart does not reflect sales to chain bookstores, Amazon, or digital sales; only what was sold to comics shops. As the calculation includes non-comics magazines, the true share for each publisher is probably slightly higher each month.
You can find many more charts of this nature in our Vital Statistics section.
Comichron founder John Jackson Miller has tracked the comics industry for more than 25 years, including a decade editing the industry’s retail trade magazine; he is the author of several guides to comics, as well as more than a hundred comic books for various franchises.
He is the author of novels including Star Wars: Kenobi, Star Wars: A New Dawn, Star Trek: Discovery – The Enterprise War, and his upcoming release, Star Trek: Strange New Worlds – The High Country. Read more about them at his fiction site.
Be sure to follow Comichron on Twitter and Facebook, and check out our Youtube channel. You can also support us on Patreon!