
Eleven
comic books sold more than a hundred thousand copies to comics
retailers in North America and two topped a quarter million, according
to Comichron’s analysis of data released by Diamond Comic Distributors. Those two copies — Marvel’s Civil War II #1 and DC’s Batman #1
— both easily outsold their respective precursor launch titles from
2006 and 2011 respectively. Click to see the sales estimates for comics
ordered in June 2016.
Marvel sold more than 381,000 copies of Civil War II #1 to retailers in June, well ahead of Civil War #1 back in May 2006,
which sold more than 260,000 copies in its first month. Granted, the
scope of that hit was a surprise back then — the third issue outsold the
first — and Marvel’s summer event last year, Secret Wars, launched with 527,000 copies. On the other hand, that issue last year was a dollar cheaper. At $5.99, Civil War II #1 brought in more than $2.28 million at full retail, more than double what the second place title made.
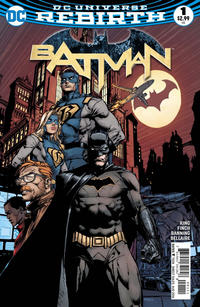
That title was Batman #1,
which set a considerable mark on its own with more than 280,000 copies
ordered. Even with its orders reduced for returnability, it outsold the
corresponding Batman #1 from the September 2011
DC relaunch; that issue sold more than 188,000 copies in its first
month. Eight DC comics topped 100,000 copies ordered. Among other titles
of note, Captain America: Steve Rogers #1 picked up an additional 13,000 copies in reorders, adding to its 99,000 total from May.
As
noted here Friday, dollar orders of comics and graphic novels in June
were at their highest level in more than 20 years, $58.59 million in a
five-week month. A small bit significant part of that comes from what
was clearly a big month for deep discounts on hardcovers and graphic
novels from Marvel: well over $1 million of the near-record $9.45
million that the Top 300 graphic novels brought in came from Marvel
books that placed above 1,000th place in Diamond’s dollar volume
rankings, meaning the cost of those books to retailers was greatly
reduced. This is an effect we’ve seen before, however, and as it tends
to happen in the last month of each quarter — perhaps as publishers seek
to clear out stock or make budgets — it doesn’t muddy up the
year-to-year comparisons as much as it otherwise might.
 Unit
Unit
sales for periodicals were up strongly as well: the Top 300 comics had
orders of 8.53 million copies, the highest figure since December 1997 when the Darkness #11-infused
market had preorders of 8.99 million copies. The 300th place title this
month approached 5,600 copies sold. (Click to see the sales of 300th-place titles across time.)
There does remain a disparity between the Top 300 comics unit and dollar performance and that of Diamond’s overall change figures for those categories: this is at least partially due to the absence of well over a million Loot Crate copies, which affected our Comichron tabulations in the breakout categories. It is also likely that a larger share of comics are being sold outside the Top 300 this year, due to the number of releases on the market.
The aggregate changes are as follows:
TOP 300 COMICS UNIT SALES
June 2016: 8.53 million copies
Versus 1 year ago this month: +14%
Versus 5 years ago this month: +42%
Versus 10 years ago this month: +22%
Versus 15 years ago this month: +56%
Q2 2016: 21.59 million copies, -10%vs. Q2 2015
YEAR TO DATE: 40.04 million copies, -10% vs. 2015, +25% vs. 2011, +2% vs. 2006, +32% vs. 2001
ALL COMICS UNIT SALES
June 2016 versus one year ago this month: +19.75%
Q2 2016 versus Q2 2015: -7.71%
YEAR TO DATE: -8.38%
June 2016: $34.13 million
Versus 1 year ago this month: +18%
Versus 5 years ago this month: +66%
Versus 10 years ago this month: +61%
Versus 15 years ago this month: +125%
Q2 2016: $86.94 million, -9% vs. Q2 2015
YEAR TO DATE: $159.74 million, -9% vs. 2015, +44% vs. 2011, +32% vs. 2006, +93% vs. 2001
ALL COMICS DOLLAR SALES
Q2 2016 versus Q2 2015: -4.21%
June 2016 versus one year ago this month: +23.06%
YEAR TO DATE: -3.84%
June 2016: $9.45 million
Versus 1 year ago this month: +17%
Versus 5 years ago this month: +45%
Versus 10 years ago this month, just the Top 100 vs. the Top 100: +45%
Versus 15 years ago this month, just the Top 25 vs. the Top 25: -33%
YEAR TO DATE: $49.21 million, +14% vs. 2015
ALL TRADE PAPERBACK SALES
Q2 2016 versus Q2 2015: +1.69%
June 2016 versus one year ago this month: +14.37%
YEAR TO DATE: +6.58%
June 2016: $43.58 million
Versus 1 year ago this month: +18%
Versus 5 years ago this month: +45%
Versus 10 years ago this month, counting just the Top 100 TPBs: +37%
Versus 15 years ago this month, counting just the Top 25 TPBs: +125%
YEAR TO DATE: $208.33 million, -5% vs. 2015
ALL COMICS AND TRADE PAPERBACK SALES
June 2016 versus one year ago this month: +20.26%Q2 2016 versus Q2 2015: -2.42%
YEAR TO DATE: -0.73%
June 2016: approximately $58.59 million (subject to revision)
Versus 1 year ago this month: +20%
Versus 5 years ago this month: +60%
Versus 10 years ago this month: +83%
Q2 2016 versus Q2 2015: -2%
YEAR TO DATE: $280.17 million, -1% vs. 2015
RELEASES
New comic books released: 536
New graphic novels released: 334
New magazines released: 34
All new releases: 904
As
noted, the average comic book in the Top 300 cost $3.98, a new record;
the average comic book
retailers ordered cost an even $4. The median and most common price for
comics offered was $3.99. This is the first time we’ve seen all four
statistics clustered so close together; it indicates that the
best-selling comics are also the most representative in terms of
pricing. Click to see comics prices across time.
Comichron founder John Jackson Miller has tracked the comics industry for more than 25 years, including a decade editing the industry’s retail trade magazine; he is the author of several guides to comics, as well as more than a hundred comic books for various franchises.
He is the author of novels including Star Wars: Kenobi, Star Wars: A New Dawn, Star Trek: Discovery – The Enterprise War, and his upcoming release, Star Trek: Strange New Worlds – The High Country. Read more about them at his fiction site.
Be sure to follow Comichron on Twitter and Facebook, and check out our Youtube channel. You can also support us on Patreon!