May 2017 was a win for the comic-book direct market, if a qualified one; comics shops ordered $48.16 million worth of comic books, trade paperbacks, and magazines in the month, an increase of more than 8% over the same month in the previous year. That month, however, had only four Wednesdays, while this May had five New Comic Book Days. Last May was also one of the weakest months of the year, a “holding pattern” month in advance of Civil War II and DC‘s Rebirth. But it’s the first up month since October 2016, so we’ll take it.
Marvel‘s performance, about which much was written this winter, improved year-over-year — although, following a pattern we’ve seen in 2017, the rest of the market improved by more. The overall market was up around $3.7 million; $700,000 of the addition came from Marvel and $3 million from everyone else. That said, Marvel’s last year-over-year beat was back in August 2016, so positive movement is noteworthy. The market without Marvel is up 4.2% for 2017, so a few more good months for the publisher could turn the industry’s year positive overall.
The challenge is going to be that, just as much of 2016 was up against big comparative months during Star Wars‘ launch year at Marvel, last summer was ginormous in dollar terms. June 2016 was the biggest month in the Direct Market this century, at $58.6 million; it also had an extra Wednesday. August 2016 was almost as big. More of DC’s books are at $3.99 this time around, so we’ll see what difference that makes.
The aggregate changes:
| Dollars | Units | |
|---|---|---|
| May 2017 Vs. April 2017 | ||
| Comics | 16.49% | 17.36% |
| Graphic Novels | 17.13% | 19.52% |
| Total Comics/Graphic Novels | 16.69% | 17.53% |
| Toys | 52.15% | 52.94% |
| May 2017 Vs. May 2016 | ||
| Comics | 10.58% | 16.74% |
| Graphic Novels | 3.54% | 13.65% |
| Total Comics/Graphic Novels | 8.31% | 16.49% |
| Toys | 40.46% | 29.34% |
| Year-To-Date 2017 Vs. Year-To-Date 2016 | ||
| Comics | 0.11% | 8.89% |
| Graphic Novels | -9.23% | -8.72% |
| Total Comics/Graphic Novels | -2.92% | 7.35% |
| Toys | 1.14% | 1.10% |
We don’t cover toys, but Diamond provides that data and they look to have bounced back by a lot.
Marvel topped both market shares categories, and improved its position in our projected annual dollar market shares, which through May are expected to wind up at Marvel 36.6%, DC 29.2%, Image 10.2%, IDW 5%, and Dark Horse 3.5%. Here’s just the month of May:
| Dollar Share | Unit Share | |
|---|---|---|
| Marvel | 38.05% | 39.91% |
| DC | 27.93% | 30.88% |
| Image | 10.25% | 11.83% |
| IDW | 4.65% | 3.78% |
| Dark Horse | 3.05% | 2.21% |
| Boom | 2.10% | 1.74% |
| Dynamite | 1.72% | 1.85% |
| Titan | 1.18% | 0.99% |
| Viz | 1.12% | 0.39% |
| Oni | 0.89% | 0.59% |
| Other Non-Top 10 | 9.06% | 5.83% |
The top-selling title of the month was Marvel’s Secret Empire #1, although May was another case where several different claimants could exist. Let’s look first at the table:
|
COMIC BOOK
|
PRICE | PUBLISHER | |
|---|---|---|---|
| 1 | Secret Empire #1 | $4.99 | Marvel |
| 2 | Venom #150 | $5.99 | Marvel |
| 3 | Batman #22 Lenticular Edition | $3.99 | DC |
| 4 | Flash #22 Lenticular Edition | $3.99 | DC |
| 5 | Guardians of the Galaxy: Mission Breakout #1 | $4.99 | Marvel |
| 6 | Secret Empire #2 | $4.99 | Marvel |
| 7 | Batman #23 | $2.99 | DC |
| 8 | Secret Empire #3 | $3.99 | Marvel |
| 9 | All-New Guardians of the Galaxy #1 | $3.99 | Marvel |
| 10 | Walking Dead #167 | $2.99 | Image |

We’ll set aside the second-place Venom #150 (one of the more complicated attempts at creating a legacy title by cobbling together the numberings of multiple series), which cost a dollar more and might or might not wind up with some bragging rights depending on how the retail rankings shake out, and look simply at copies shipped. There, there’s little doubt what image shipped more copies: Image’s Saga #43, which as part of the publisher’s 25th anniversary program shipped with a 25¢ cover price. We won’t see an exact number of copies because Diamond does not include comics priced below $1 in its charts — but it was surely the highest-volume book.
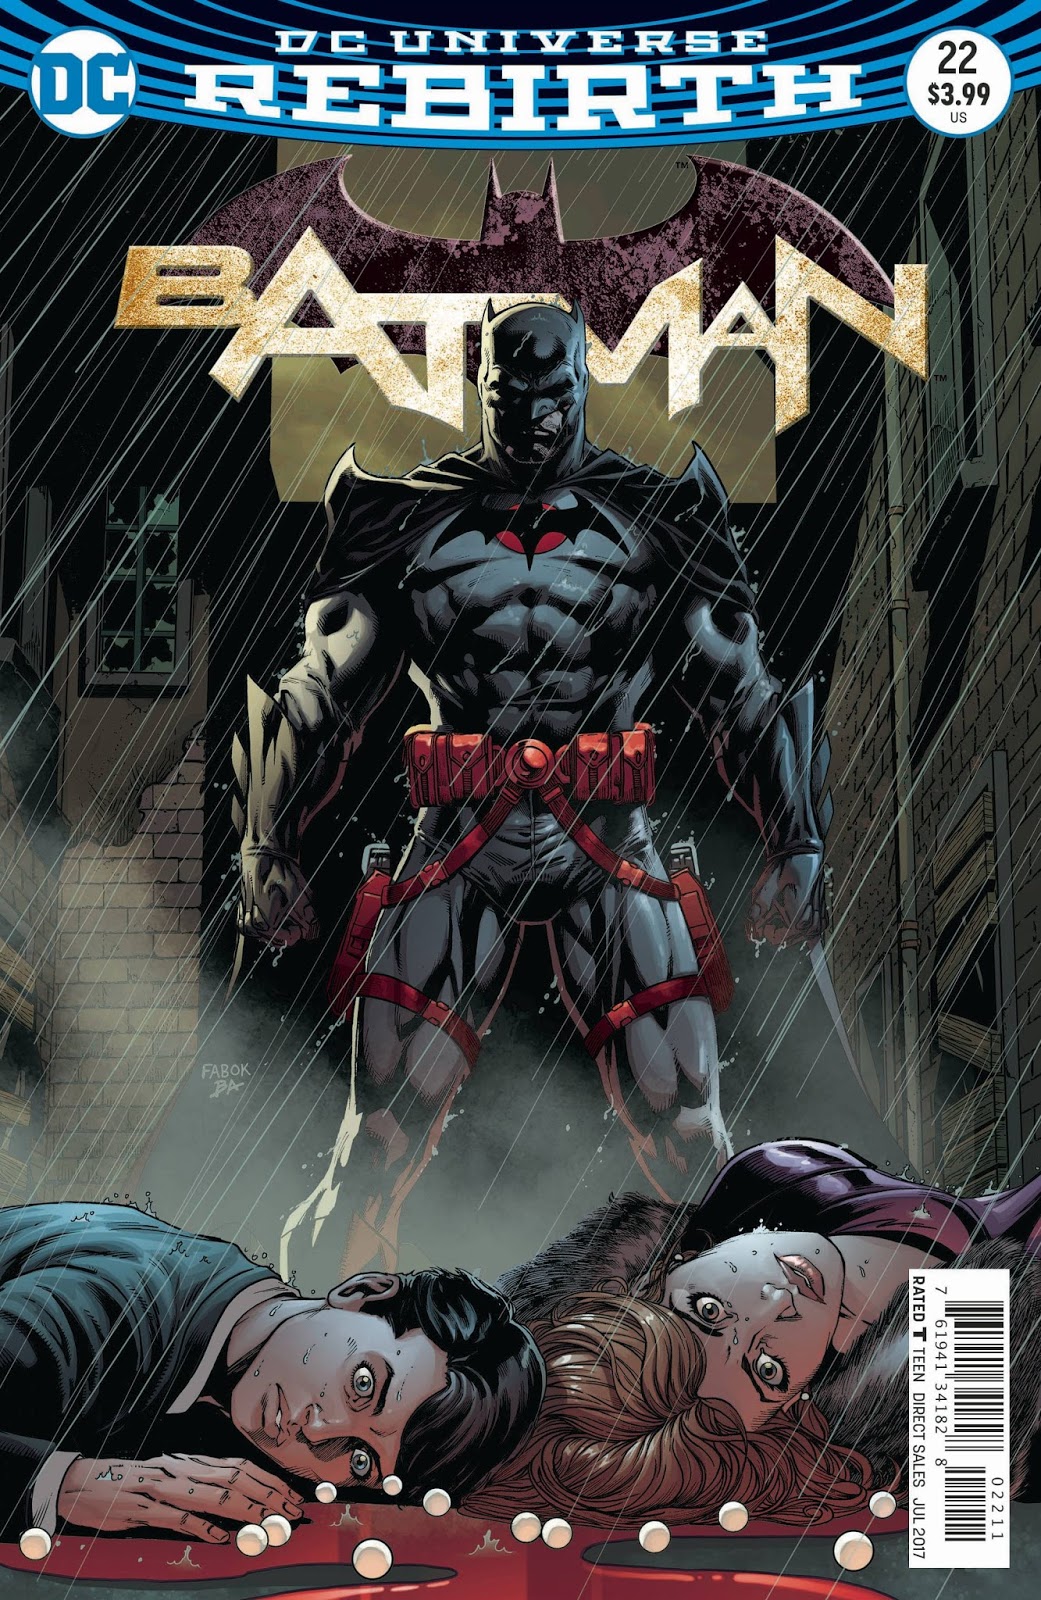
Then, as with April, we have a situation where both DC’s Batman #22 and Flash #22 “Button” issues had lenticular covers priced at a dollar more than their regular versions, and following long-standing convention, Diamond splits those books up in its rankings. We’ll know on Monday whether the combined versions might account for enough copies again to surpass the nominal first-place book. I wrote last month about why such issues are divided into separate entries; back in 1994 you’d see the Deluxe and Newsstand versions of Marvel’s books likewise split up.

It’s all a reminder that, as I’ve written many times, the distributor charts are not a scoreboard. They were created to help retailers place their future orders, and it’s helpful for them to, for example, know how the lenticular and regular versions were ordered relative to one another. Yielding a true “winner” every month for spectator interest is irrelevant to the charts’ purpose; for the shops, it’s not a game.
Marvels Guardians line got two top-ten entries, Guardians of the Galaxy: Mission Breakout #1 and All-New Guardians of the Galaxy #1, in a month in which its movie sequel released to a huge opening.
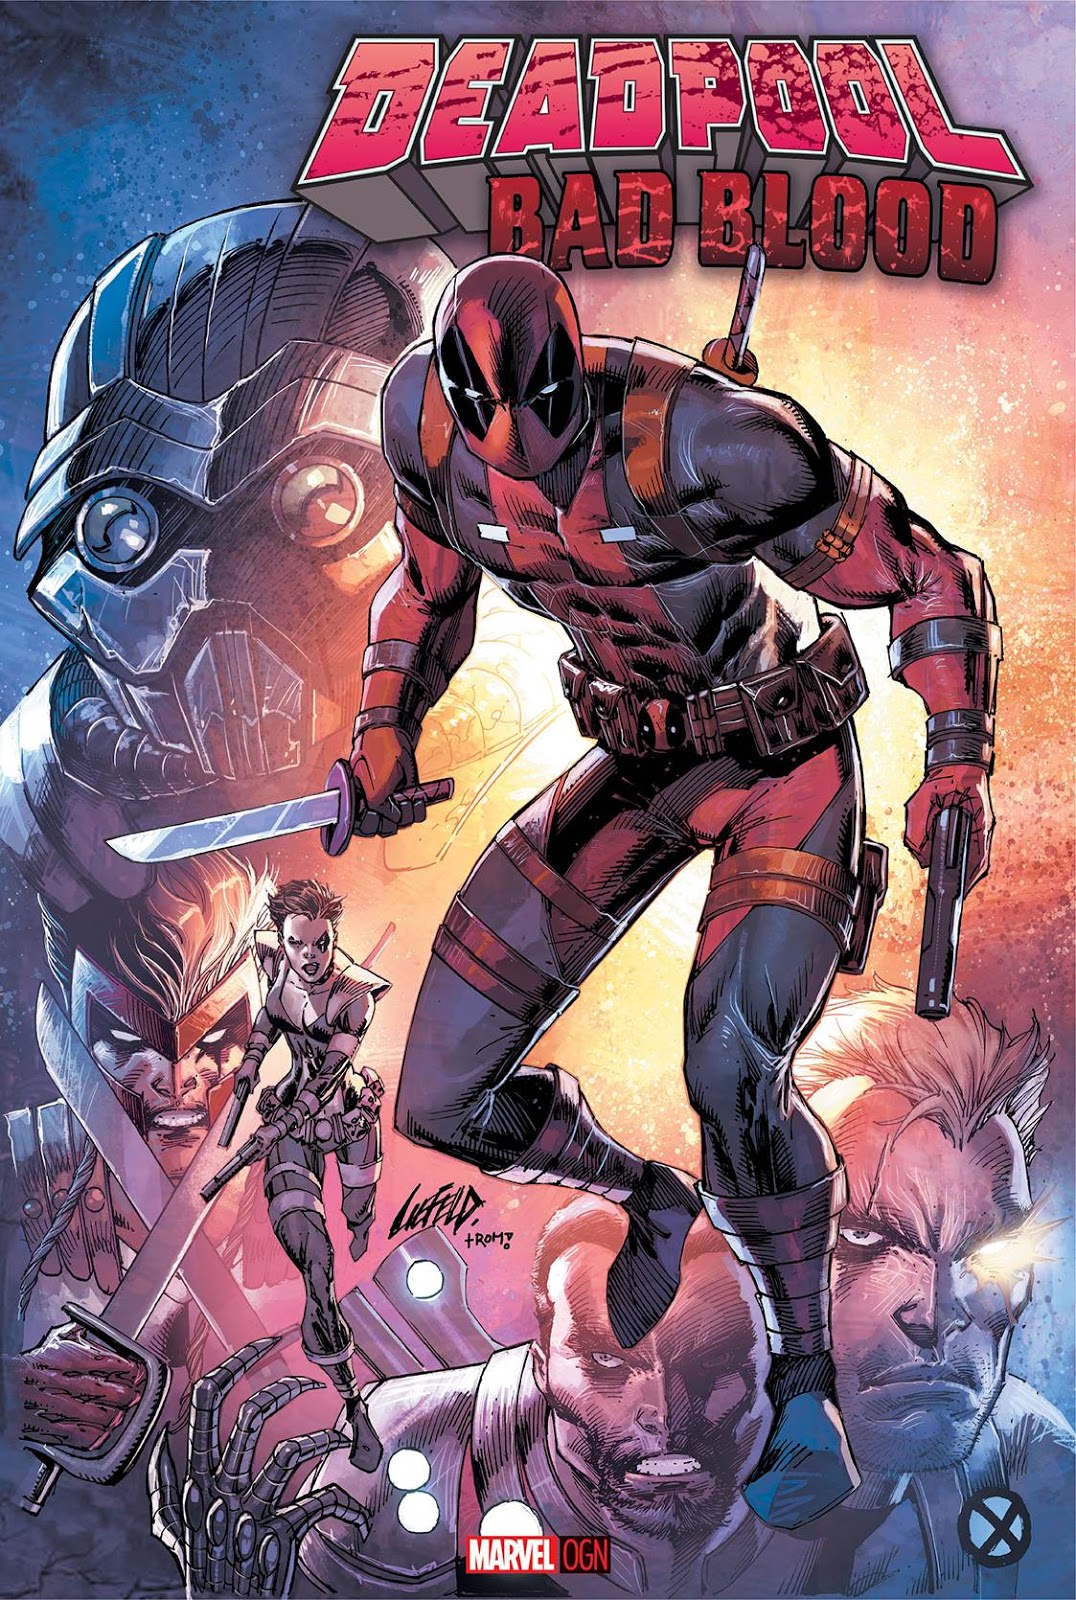
Graphic novels bounced back, finally, aided by a bigger-ticket item in Deadpool: Bad Blood. The book featured the return to the top of the charts by Rob Liefeld, nearly 26 years after his first top-seller on the comics charts, June 1991’s X-Force #1. But the bigger factor appears to be a large increase in the number of new graphic novels shipped, from 271 last May up to 358. That’s more than the fifth week would be expected to add.
The chart:
|
GRAPHIC NOVEL
|
PRICE | PUBLISHER | |
|---|---|---|---|
| 1 | Deadpool: Bad Blood HC | $24.99 | Marvel |
| 2 | Bitch Planet Volume 2: President Bitch | $14.99 | Image |
| 3 | Saga Vol. 7 | $14.99 | Image |
| 4 | Wonder Woman Volume 2: Year One | $16.99 | DC |
| 5 | Moonshine Vol. 1 | $9.99 | Image |
| 6 | Flash Vol. 2: The Speed of Darkness | $14.99 | DC |
| 7 | Champions Vol. 1: Change the World | $15.99 | Marvel |
| 8 | Batman: Detective Comics Vol. 2: Victim Syndicate | $16.99 | DC |
| 9 | Unworthy Thor | $15.99 | Marvel |
| 10 | Doom Patrol Vol. 1: Brick By Brick | $16.99 | DC |
And speaking of new release volume we see that the big increase in new comics came from Image, which had 71 new periodical entries in the month. That’s the highest figure for the company since December 2015.
|
Publisher
|
Comics shipped |
Graphic Novels shipped |
Magazines | Total shipped |
|---|---|---|---|---|
| Marvel | 99 |
43
|
0
|
142
|
|
DC
|
82
|
34
|
0
|
116
|
|
Image
|
71
|
14
|
1
|
86
|
|
IDW
|
59
|
15
|
0
|
74
|
|
Boom
|
26
|
10
|
0
|
36
|
|
Titan
|
22
|
7
|
4
|
33
|
|
Dark Horse
|
20
|
12
|
0
|
32
|
|
Dynamite
|
23
|
7
|
0
|
30
|
|
Oni
|
6
|
4
|
0
|
10
|
|
Viz
|
0
|
9
|
0
|
9
|
|
Other
|
119
|
203
|
28
|
350
|
|
TOTAL SHIPPED
|
527
|
358
|
33
|
918
|
Look for the full charts and estimates here on Monday.
Comichron founder John Jackson Miller has tracked the comics industry for more than 25 years, including a decade editing the industry’s retail trade magazine; he is the author of several guides to comics, as well as more than a hundred comic books for various franchises.
He is the author of novels including Star Wars: Kenobi, Star Wars: A New Dawn, Star Trek: Discovery – The Enterprise War, and his upcoming release, Star Trek: Strange New Worlds – The High Country. Read more about them at his fiction site.
Be sure to follow Comichron on Twitter and Facebook, and check out our Youtube channel. You can also support us on Patreon!
