
As reported here on Friday — and in our preliminary video report about the month — April 2018 represented a significant improvement in the fortunes of the Direct Market, thanks in considerable measure to a comic book 80 years in the making: Action Comics #1000, which dominated the comics sales charts — as its companion Action: 80 Years of Superman hardcover did the graphic novel charts. Thanks to Diamond Comic Distributors, we now have further information: click to see Comichron’s estimated sales for individual April 2018 comics and graphic novels.
The reader will immediately note that, while DC reported orders of 500,000 copies back in April, North American shipments in April totaled just under 450,000 copies. Reorders outside April, which are known to be significant, and copies bound for overseas would easily cover the rest. (Including overseas sales would defeat the primary purpose of the distributor sales charts, which is to tell North American retailers how many copies are in circulation in their geographic market. Read more in our FAQ.) The issue accounted for $3.6 million of all product ordered in April, somewhat less than the total amount of the month’s increase over the previous year.
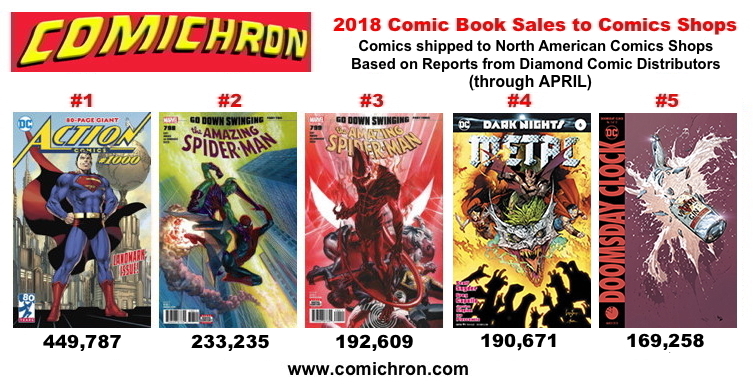
But while Action‘s sales were monumental, it was not the whole story of the month. Six issues above 100,000 copies is the most seen in some time, and the top three sellers immediately became the top-sellers for the year so far:
April accounts for five of the top ten so far. Earlier issues continue to advance, with March’s Weapon H #1 topping 100,000 on reorders. You can see the rest of our running totals for 2018 here.
As reported Friday, Marvel and DC’s dollar sales for the month at full retail were up 19% and 18% respectively year-over-year, while Oni, IDW, and Dynamite‘s April-versus-April beats were even larger. Marvel’s incentive-copy targets were reportedly easier to hit in the month than they had been previously, which seems likely to have helped its performance.
Diamond shipped more than 6.8 million comic books to North American shops in April, a quantity that again reinforces the stability of periodicals in the market across time:
April 2013: 6.8 million copies
So that’s twenty years in a fairly narrow range. (We don’t know Diamond’s portion of the all-time dollar record month April 1993 exactly, but all Direct Market distributors are suspected to have sold 48 million copies.)
Winter volumes are such that a good April can wipe out a poor winter; April 2018 didn’t quite accomplish that, but it did bring the year-to-date shortfall below 4%.
The vital statistics for the month:
-->| TOP 300 COMICS SHIPPED (in UNITS) |
||
| April 2018 | 6.82 million copies | |
| 1 Year Ago | 6.52 million copies | +5% |
| 5 Years Ago | 6.79 million copies | 0% |
| 10 Years Ago | 6.71 million copies | +2% |
| 15 Years Ago | 6.02 million copies | +13% |
| 20 Years Ago | 7.03 million copies | -3% |
| Top 500 Comics Shipped (Units) | 7.23 million copies | |
| ALL Comics Shipped in Month (Units) |
7.37 million copies | +4% |
| Year To Date | 24.65 million copies | |
| 1 Year Ago | 26.52 million copies | -7 |
| 5 Years Ago | 27.72 million copies | -11 |
| 10 Years Ago | 25.82 million copies | -5 |
| 15 Years Ago | 23.07 million copies | 7 |
| ALL Comics Shipped Year to Date (Units) |
26.94 million copies | -10% |
| TOP 300 COMICS SHIPPED (in DOLLARS) |
||
| April 2018 | $28.19 million | |
| 1 Year Ago | $27.57 million | -10% |
| 5 Years Ago | $21.34 million | +16% |
| 10 Years Ago | $21.82 million | +13% |
| 15 Years Ago | $16.27 million | +52% |
| 20 Years Ago | $20.62 million | +20% |
| Top 500 Comics Shipped (Dollars) |
$29.9 million | |
| ALL Comics Shipped during Month (Dollars) |
+16% | |
| Year To Date | $100.12 million | |
| 1 Year Ago | $100.37 million | 0% |
| 5 Years Ago | $82.94 million | +21% |
| 10 Years Ago | $85.96 million | +16% |
| 15 Years Ago | $62.08 million | +61% |
| ALL Comics Shipped Year to Date (Dollars) |
-2% | |
| TOP GRAPHIC NOVELS SHIPPED (in DOLLARS) |
||
| April 2018 (Top 300 GNs) | $6.57 million | |
| April 2018 (Top 100 GNs) |
$4.32 million | |
| April 2018 (Top 50 GNs) |
$2.96 million | |
| April 2018 (Top 25 GNs) |
$2.16 million | |
| Versus 1 Year Ago |
$6.45 million | +2% |
| Versus 5 Years Ago (Top 300) |
$8.77 million | -25% |
| Versus 10 Years Ago (Top 100) |
$4.38 million | -1% |
| Versus 15 Years Ago (Top 50) |
$2.61 million | +13% |
| Top 500 Graphic Novel Shipped in Month (Dollars) |
$7.61 million | |
| ALL Graphic Novel Shipped in Month (Dollars) |
+1% | |
| Year To Date | $22.44 million | |
| 1 Year Ago | $30.66 million | -27% |
| ALL Graphic Novel Dollars Shipped Year to Date (Dollars) |
-10% | |
| TOP 300 COMICS plus TOP GNs SHIPPED (in DOLLARS) |
||
| April 2018 (including Top 300 GNs) |
$34.75 million | |
| April 2018 (including Top 300 GNs) |
$32.51 million | |
| April 2018 (including Top 100 GNs) |
$31.14 million | |
| April 2018 (including Top 25 GNs) |
$30.34 million | |
| Versus 1 Year Ago |
$31.17 million | +11% |
| Versus 5 Years Ago (Top 300) |
$33.05 million | -2% |
| Versus 10 Years Ago (Top 50) |
$26.19 million | +8% |
| Versus 15 Years Ago (Top 50) |
$19.34 million | +73% |
| Top 500 Comics & Top 500 GNs Shipped in Month (Dollars) |
$37.51 million | |
| All Comics & GNs Shipped in Month (Dollars) |
+11% | |
| Year To Date | $120 million | |
| 1 Year Ago | $130.82 million | -8% |
| ALL Comics & GNs Shipped Year to Date (Dollars) |
-4% | |
| ALL COMICS AND GNs SHIPPED (in Dollars) |
||
| April 2018 | $45,843,400.00 | |
| Versus 1 Year Ago |
$41.2691 million | +11% |
| Versus 5 Years Ago |
$41.108 million | +12% |
| Versus 10 Years Ago |
$36.74 million | +25% |
| Year To Date | $160.3 million | |
| 1 Year Ago | $166.937 million | -4% |
| TITLE SPECIFICS | ||
| TOP SELLING COMIC BOOK | ||
| Action Comics #1000 |
449,787 copies at | $7.99 |
| 50th PLACE COMIC BOOK |
||
| Marvel Two-In-One #5 |
34,198 copies at | $3.99 |
| 100th PLACE COMIC BOOK |
||
| Weapon X #16 | 23,695 copies at | $3.99 |
| 150th PLACE COMIC BOOK |
||
| Iron Fist #80 | 13,645 copies at | $3.99 |
| 200th PLACE COMIC BOOK |
||
| Cyborg #21 | 8,290 copies at | $3.99 |
| 300th PLACE COMIC BOOK |
||
| Demi-God #1 | 3,854 copies at | $3.99 |
| 400th PLACE COMIC BOOK |
||
| Knights of the Dinner Table #253 |
2,048 copies at | $3.99 |
| 500th PLACE COMIC BOOK |
||
| Archie Jumbo Comics Digest #288 |
711 copies at | $3.99 |
| NEW RELEASE VOLUME |
||
| New Comics Released |
449 | |
| New Graphic Novels Released |
318 | |
| New Magazines Released |
26 | |
| Total New Print Items Released |
793 | |
| PRICING | ||
| Average Cover Price of Comics in the Top 300 |
$3.92 | |
| Average Cover Price of Comics in the Top 300, weighted by orders |
$4.14 | |
| Average Cover Price of Comics in the Top 25 |
$4.15 | |
| Median Cover Price of Comics in the Top 300 |
$3.99 | |
| Most Common Cover Price of Comics in the Top 300 |
$3.99 |
Comichron founder John Jackson Miller has tracked the comics industry for more than 25 years, including a decade editing the industry’s retail trade magazine; he is the author of several guides to comics, as well as more than a hundred comic books for various franchises.
He is the author of novels including Star Wars: Kenobi, Star Wars: A New Dawn, Star Trek: Discovery – The Enterprise War, and his upcoming release, Star Trek: Strange New Worlds – The High Country. Read more about them at his fiction site.
Be sure to follow Comichron on Twitter and Facebook, and check out our Youtube channel. You can also support us on Patreon!